The PAHO Strategic Plan 2020 – 2025 (SP20–25) set out a comprehensive results framework which outlined how health impact across three level of results would be delivered in the Region. In implementing the SP20–25 and its program budgets, progress at all three results levels depended on the joint action of the Pan American Sanitary Bureau (PASB), Member States, and partners and was measured through:
The final assessment of the 28 impact indicators confirms a mixed performance, with 9 (32%) indicators that either reached their targets (4) or were on the right track (5), while 16 (57%) were either stagnating (11) or on the wrong track (5) and required acceleration; and 3 (11%) did not have enough data for robust assessment.
Review the overall assessment of the Impact indicators or select the indicators below to explore detailed analysis and recommendations.
▲ Achieved (4) ↗ Right track (5) ▶ Stagnating (11) ▼ Wrong track (5) − Not enough data (3)
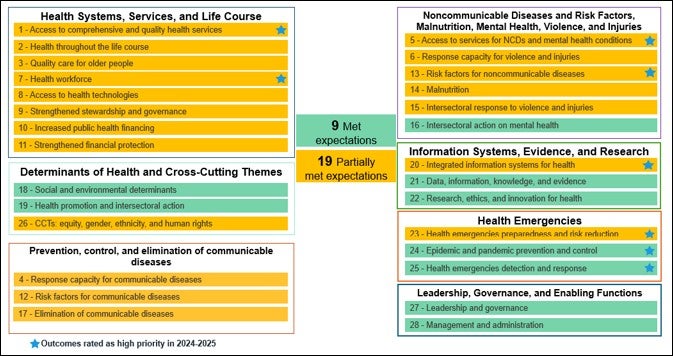
The assessment of outcomes and outputs, including their corresponding indicators, is based on the joint assessment of outcome and output indicators completed with Member States. As shown in the figure below, 9 of the 28 outcomes (32%) were assessed as having met expectations for the 2024–2025 biennium, meaning that implementation of the SP20–25 and PB24–25 progressed as planned toward the delivery of expected results. The other 19 outcomes (68%) were rated as having partially met expectations, meaning that there was some progress toward achieving the indicator targets; however, implementation was affected by delays or impediments.
Status of SP20–25 Outcomes
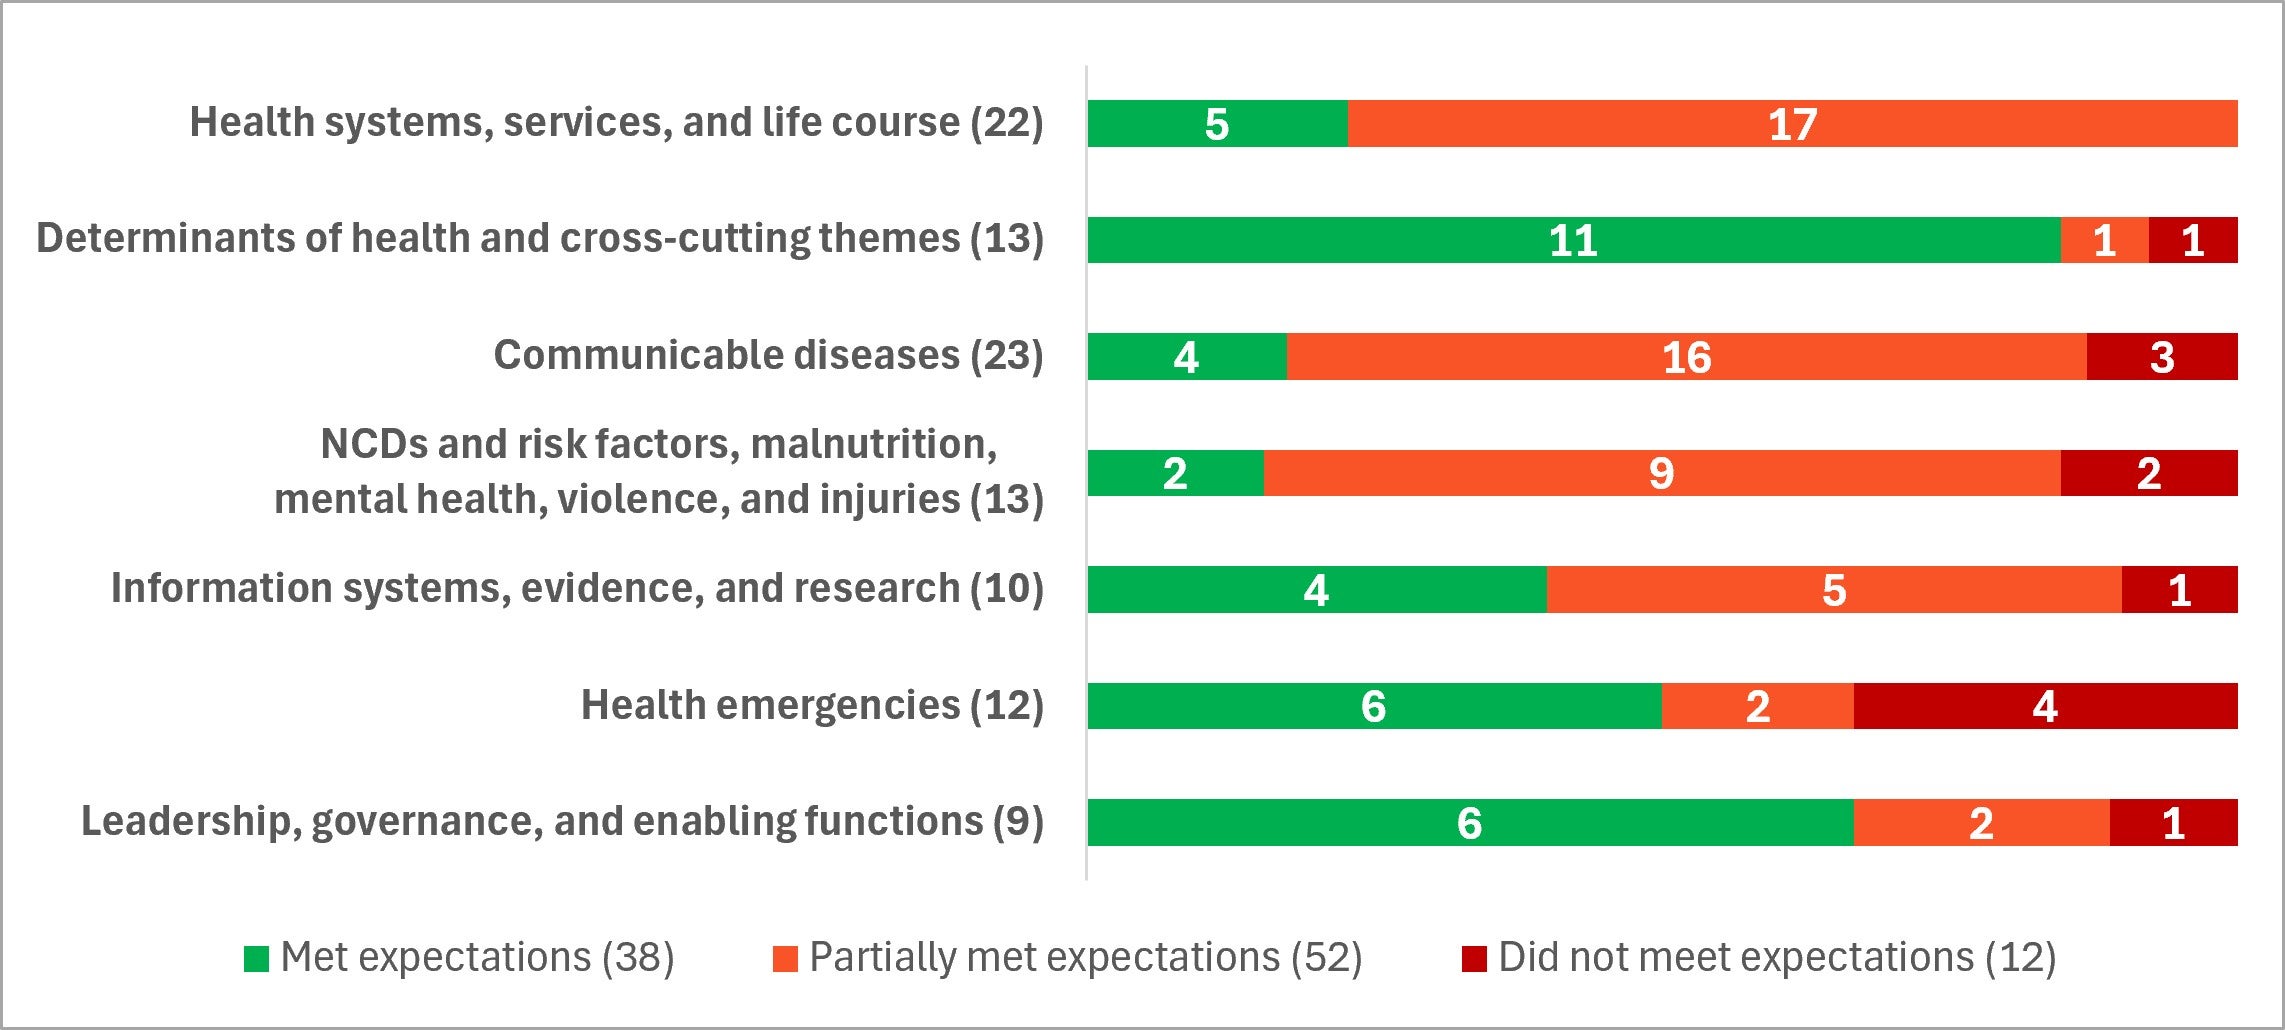
As shown in the figure below, 38 of the 102 outputs (37%) were assessed as having met expectations for the 2024–2025 biennium, 52 outputs (51%) were rated as partially meeting expectations, and 12 outputs (12%) did not meet expectations. This represents a slight improvement compared to the 2022–2023 outputs when 30% met, 56% partially met, and 14% did not meet expectations.
Status of PB24–25 Outputs
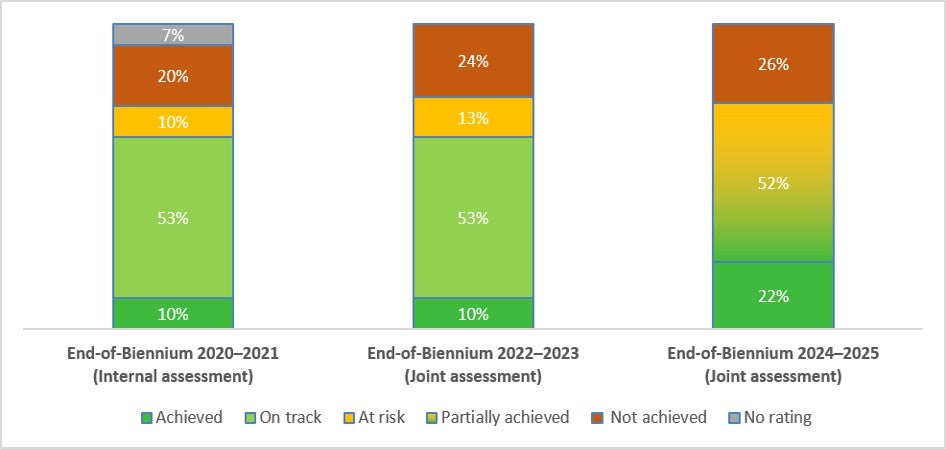
The joint assessment reveals that at the end of 2025, progress was made toward the achievement of the outcome and output indicator targets. As shown in Figure 5, 22% of 105 outcome indicators were achieved (23), 52% were partially achieved (55), and 26% were not achieved (27). Over the six-year period, the share of indicator targets rated as achieved increased from 10% in both 2020–2021 and 2022–2023 to 22% in 2024–2025. However, compared with the end of the PAHO Strategic Plan 2014–2019, the proportion achieved declined from 33% to 22%.
Outcome indicator assessment from 2020 to 2025
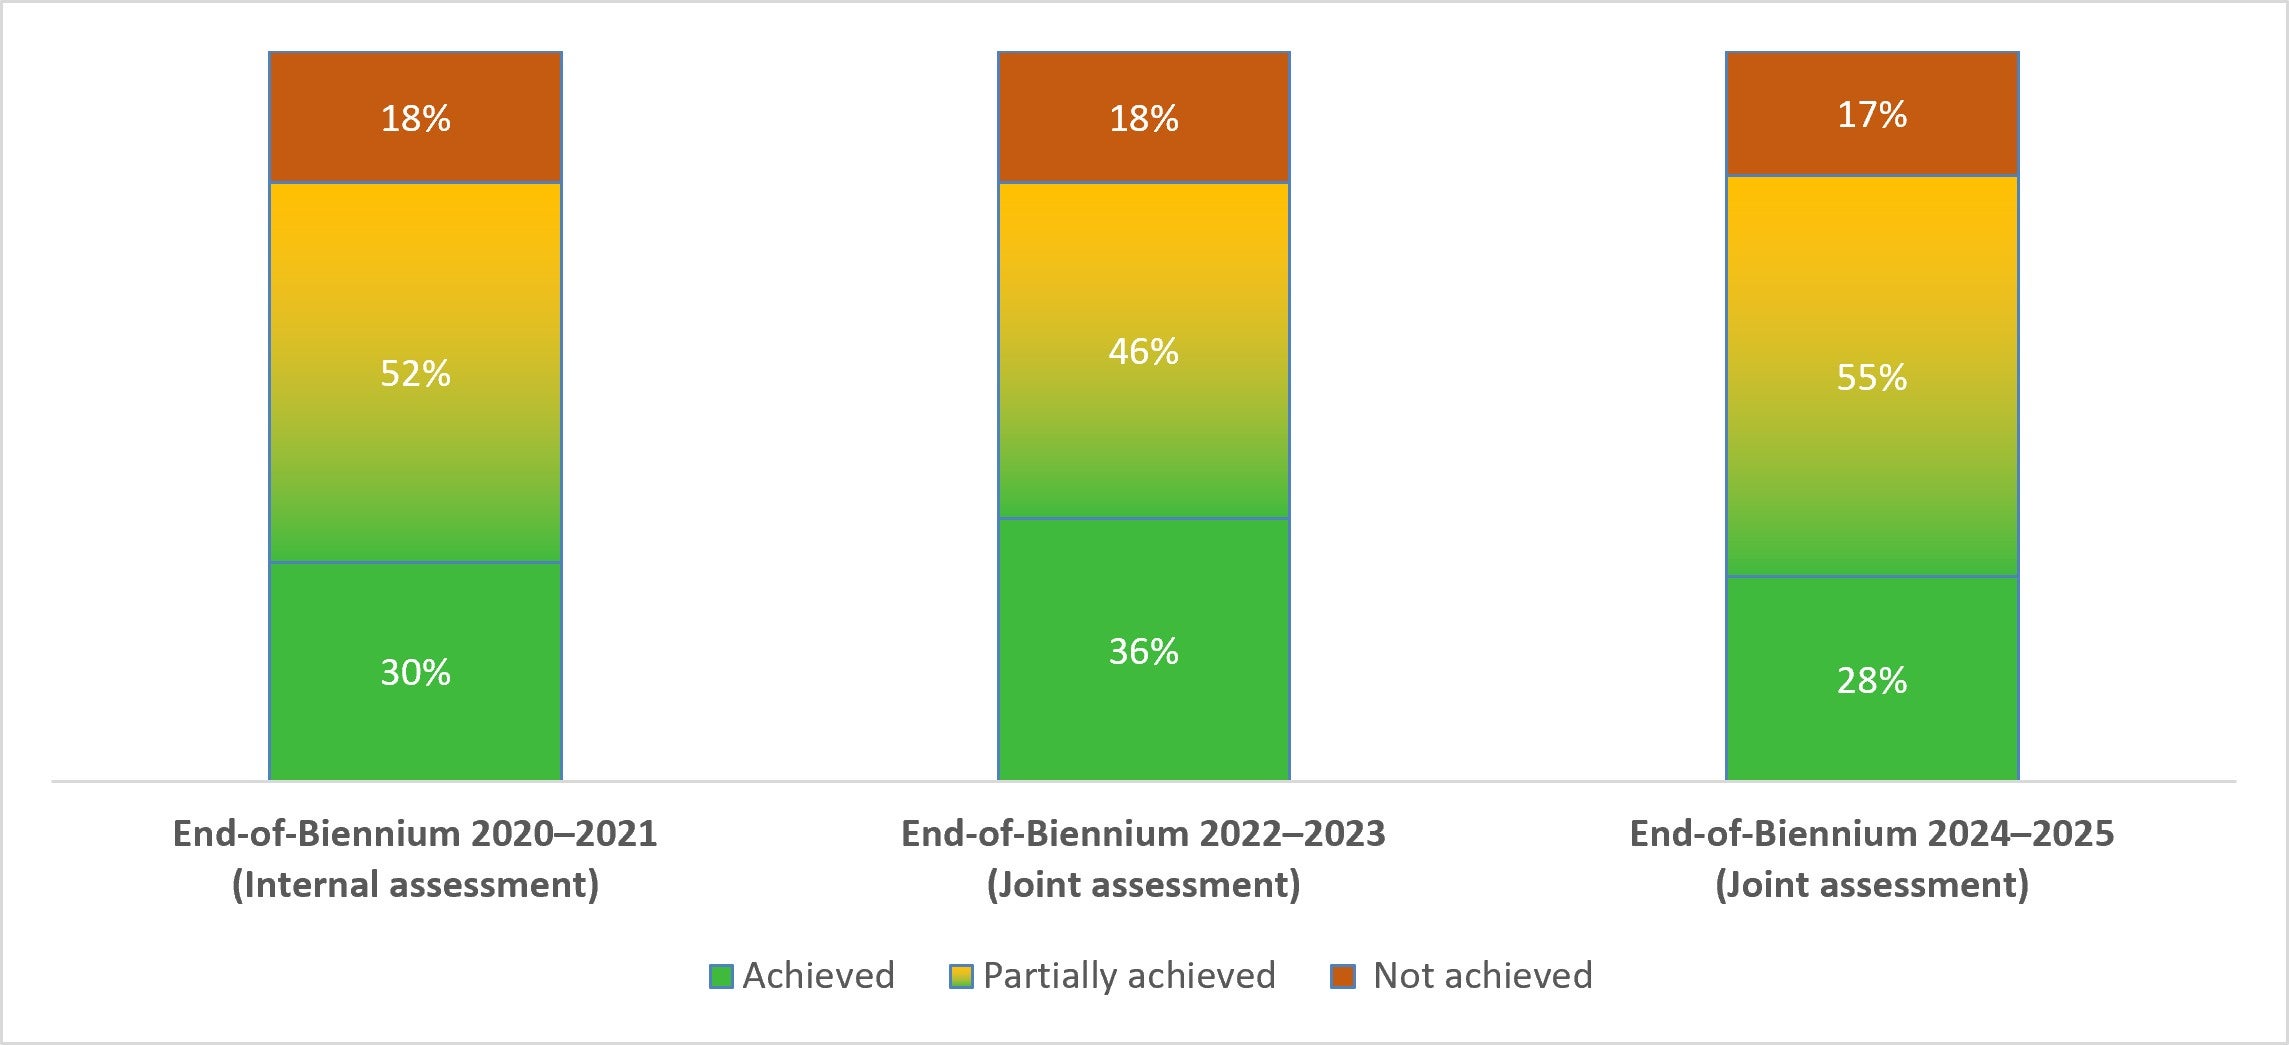
As shown in the figure below, 28% of 143 output indicator targets were achieved (40), while 55% were partially achieved (79) and 17% not achieved (24). Compared with the assessments for the PAHO Program Budget 2020–2021 and the PAHO Program Budget 2022–2023, which covered largely the same indicators, the picture was mixed, with the proportion achieved varying from 30% in 2020–2021 and 36% in 2022–2023 to 28% in 2024–2025, while the proportion not achieved declined slightly from 18% in both 2020–2021 and 2022–2023 to 17% in 2024–2025. The share of indicators rated as partially achieved decreased from 52% in 2020–2021 to 46% in 2022–2023, before rising to 55% in 2024–2025.
Output indicator assessment from 2020 to 2025
In light of the interconnection between outcomes, and to provide a more comprehensive view, the outcomes have been grouped into outcome clusters. The clusters allowed for an integrated approach during planning, implementation, performance monitoring and assessment, and reporting processes.
Select an outcome cluster to explore more information on the achievements and challenges.
Building on the lessons learned from past assessments, PAHO follows a structured approach for defining results, indicators, and baselines and targets and assessing the Organization’s performance, in line with its results-based management framework.
Impact and outcome results were defined in the SP20–25, and outputs in the PB24–25, together with the corresponding indicators and baselines and targets to support performance measurement. Impact and outcome indicators were designed to assess progress over the full life of the Strategic Plan, while output indicators were established with biennial targets. Each indicator has technical specifications that outline the achievement criteria, data sources, limitations, and other relevant information to facilitate indicator monitoring.
The indicator assessments present trends over the past two decades, considering the most recently available data that have been standardized to facilitate comparative analyses among countries and territories in the Region of the Americas. These data are also used to project estimates through 2025—the end of the Strategic Plan period. Each assessment includes a summary table with the indicator baseline, target, current status, and rating. Additionally, an analysis is presented for each impact indicator, followed by recommendations to improve health outcomes.
For the 2024–2025 End-of-Biennium assessment, which also marks the final biennium of the Strategic Plan, outcome and output indicators were rated according to the achievement criteria established for each indicator in the compendium of indicators. The joint assessment process began with an internal assessment by PASB (both country offices and regional teams) and was subsequently reviewed with national authorities. Where discrepancies in ratings were identified, dialogue was encouraged to reach a shared understanding and validate the final assessment.
The overall indicator rating criteria are defined as follows:
- achieved: at least 90% of the target value was reached, including the baseline being maintained.
- partially achieved: baseline was maintained, and at least one additional unit was reached, but below 90% of the target value.
- not achieved: either the baseline was maintained, but there was no progress above it, or it was maintained, but the overall result did not reach 90% of the target value, or there was a reduction from the baseline.